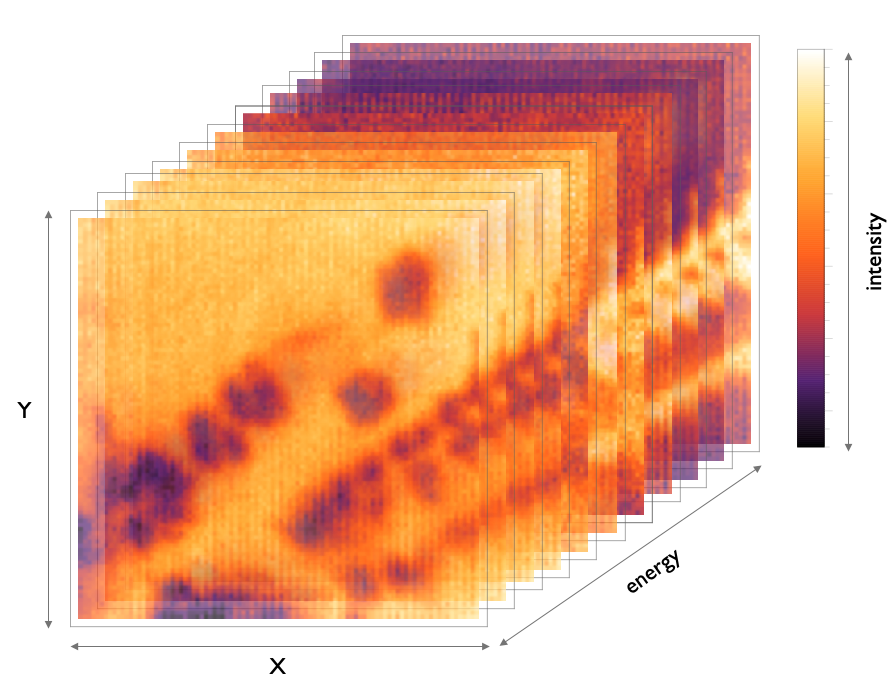
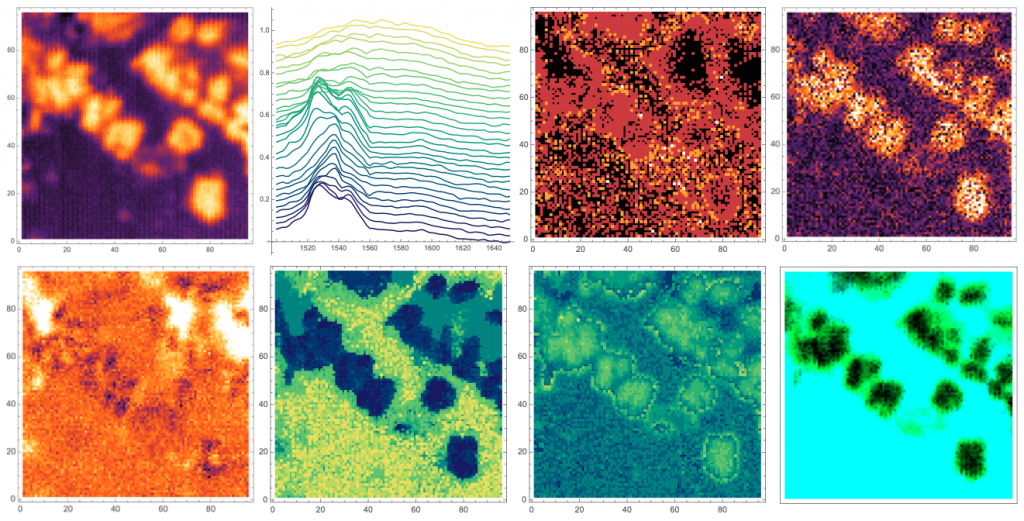
The spectroscopy field is moving towards collecting increasingly large datasets that span multiple dimensions. For instance, we can now measure infrared hyperspectral maps over time with relative ease, giving us the possibility to investigate intensity changes as function of time, energy and two spatial coordinates.

Large datasets cannot be analysed by hand. We are continuously searching, testing and implementing methods to automate the steps of data pre-processing, correction and analysis to yield reliable information about our samples. Additionally, we develop ways to visualise the results of such multidimensional data analysis in an attractive and clear manner (1,2).

